
2008-2011 Car Crash Statistics
The National Highway Traffic Safety Administration has just released their latest report on car crash statistics covering 2008-2011. It is important to understand accident statistics in the context of driver behavior and safety features in vehicles so that we can decrease accidents and corresponding fatalities and injuries with education and improved safety features.
2008-2011 Car Crash Statistics
Fatalities and Injuries in Non-Traffic Crashes
On average, 1,621 people were killed each year in non-traffic car accidents between 2008-2011. Approximately 39 percent of these people were not in the vehicle and were pedestrians or bicyclists. On average, 91,000 people were injured in car accidents in each of these years and 35 percent of those were non-vehicle occupants.
Child Fatalities and Injuries in Non-traffic Crashes
Between 2008-2011, non-traffic car accidents took the lives of about 1,043 children under the age of 14. Thirty thousand children were injured in car accidents during the same time frame. Interestingly, about 85 percent of those killed and 60 percent of those injured were not occupants of the vehicle but were instead pedestrians or bicyclists. Eighty-four percent of the non-occupant children who died were aged four and younger. In 2012, there were 33,561 fatalities from traffic accidents and children 14 and younger accounted for just three percent of them.
Distracted Driving
In 2012, ten percent of all fatal car crashes, 18 percent of car crashes resulting in injuries, and 16 percent of all car crashes were as a result of distracted driving. Distracted driving includes cell phone use, eating, talking to other passengers, adjusting the radio, applying makeup, etc.
Senior Drivers
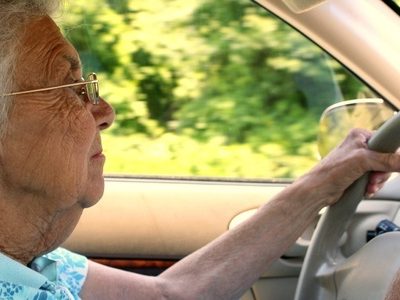
In 2012, 5,560 people aged 65 and older were killed and 214,000 were injured in car crashes. Senior drivers were involved in 17 percent of all traffic fatalities and nine percent of all people injured in traffic crashes during the year. The 2012 numbers showed a 16 percent increase in senior driver fatalities over 2011.
Seat Belt Safety
In 2012, 21,667 passengers in motor vehicles (passenger cars, pickup trucks, vans, and SUVs) died in car crashes. Of these occupants, 9,679 were wearing seatbelts (restrained). It was not known whether 1,653 of these occupants were restrained. Where it is known definitively, 52 percent of passengers who died in motor vehicle crashes were not restrained at the time of impact.
Use of Electronic Devices While Driving
Research showed that the percentage of drivers’ text messaging or visibly using their hand-held electronic devices increased from 1.3 percent in 2011 to 1.5 percent in 2012. Hand-held cell phone use remained stable at five percent of drivers with usage higher among female drivers and those between the ages of 16 and 24 years old.
Accidents with Large Trucks
In 2012, there were 3,921 people killed and 104,000 people injured in 317,000 car crashes involving large trucks. Large trucks have a gross vehicle weight rating greater than 10,000 pounds.
2013 Projection
A projection for the first nine months of 2013 shows that an estimated 24,270 people died in car crashes during that period. These numbers are a welcome decrease of about 3.7 percent when compared to the 25,214 fatalities that occurred in the first nine months of 2012.
If you or a loved one were injured in an accident, you have enough to deal with. Let an experienced accident attorney fight for the full compensation that you deserve. It is not uncommon to receive a settlement from the insurance company that is five to ten times bigger with the help of a lawyer. Call the caring accident attorneys at Tario & Associates, P.S. in Bellingham, WA today for a FREE consultation! We have been representing residents of Whatcom County, Skagit County, Island County and Snohomish County since 1979. You will pay nothing up front and no attorney fees at all unless we recover damages for you!


